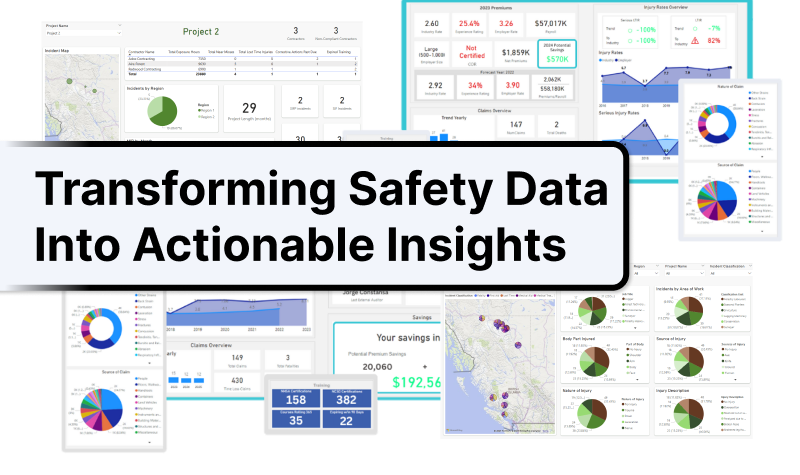
Using Data to Reduce Injuries and Costs
Firms are motivated by understanding their injury performance measured against the performance of their peers.

Firms are motivated by understanding their injury performance measured against the performance of their peers.
Using COR audit results and WCB claims data, we studied the effectiveness of the COR program in three subsectors.
What if we could actually analyze trends and benchmark against other companies? Educate senior management, using numbers to show leading indicators?
The OPM survey can provide insights into the strengths and weaknesses of an organization and strengthen accountability for practicing safety measures.
Anyone who has been in health and safety, or had it as part of their “performance measurement”, knows what the TRIF (or TRIR) is.
We have all seen the well-used comedy prop, a banana peel. Little did you know - it comes from a real safety hazard of the past.
A leading indicator in safety is a piece of data that corresponds with and can help to predict and forecast future change in risk and unsafe events.
If you thought of becoming a data scientist, you probably took one of those fancy courses where they taught you how to train deep neural networks.
Safety Fatigue is a workplace/worker condition where apathy towards policy & procedure is heightened to ineffectiveness & increasing risk/negative...
After years of working with safety data, we have seen it all. Failing to get your safety data collection right can cause injuries or fatalities.
I highly recommend that any buyer of construction services start by confirming that their contractor is COR certified.
A growing body of evidence suggests that implementing COR in small Saskatchewan construction firms can reduce occurrence of all injures by up to 40%.
Anecdotally, we have observed that firms experiencing what we call “business expansion” seem to experience higher injury rates.